Diagnostic print_r statements and logging might be quick and easy tools for investigating what Magento is doing, but a full debugger offers a lot more power and flexibility. This post demonstrates how to set up the xdebug debugger for use with the vim editor.
First of all, I'd like to thank Box.net for their great Xdebug tutorial. Check it out for a more in-depth look at using Xdebug and vim.
To start, install the Xdebug PHP extension on your server. Note that this has to be installed as a Zend extension, not a normal PHP extension. You can obtain the Xdebug extension from xdebug.org, or you can install it via your package manager on a Linux system. On a Debian-based system, use:
apt-get install php5-xdebugEdit your PHP config file and make sure you have the following settings. The
zend_extensionline may point to a different location for your system. (If you have installed Xdebug using a package manager they may already be set up for you.)zend_extension = /usr/lib/php5/20060613+lfs/xdebug.so xdebug.remote_enable = 1 xdebug.remote_port = 9000 xdebug.remote_host = localhostRestart your web server once Xdebug has been installed.
Get the DBGp vim script. This will allow vim to act as a debugging client for anything supporting the DBGp protocol - such as Xdebug. Create a
.vim/plugin/directory in your home directory on the server if it doesn't already exist, and extract thedebugger.pyanddebugger.vimfiles into it.Note that for this to work, your vim installation must be compiled with Python support. If you've installed a standard vim package from a package manager you'll probably already have this; if not, install a 'full' vim package rather than a minimal one. To check, type
:versionin vim command mode; you should see+pythonand+signs.These instructions also assume you're running the web server and debug client (vim) on the same machine. If you want to run the debug client on a different machine, you can adjust the xebug.remote_host PHP setting above.
If you're using Firefox, get the Xdebug Helper Firefox extension. This provides you with a small Xdebug icon that lets you turn the Xdebug headers on or off. This appears as an X-in-a-circle logo at the bottom-right of your Firefox window; click on it to turn Xdebug on (the icon will turn yellow-green).
If you're not using Firefox, you can turn Xdebug on by appending
XDEBUG_SESSION_START=1as a URL parameter. For example,www.magentostore.com/hatswould becomewww.magentostore.com/hats?XDEBUG_SESSION_START=1.Once you've got Xdebug started in your browser, either by turning it on using the Firefox extension or by appending to the URL, run vim. Press F5 and you should get a notice saying
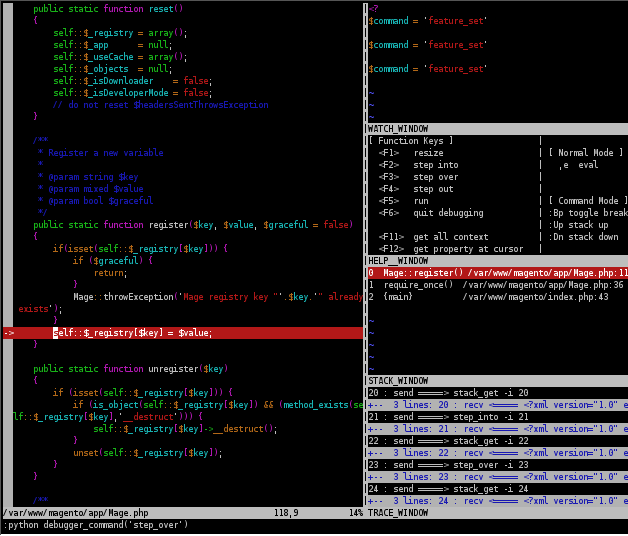
waiting for a new connection on port 9000 for 5 seconds.... Once you see that, you have five seconds to start a debugging session by sending an Xdebug-enabled request from your browser. Type in the URL you want in your browser, switch to vim, hit F5, then quickly switch to your browser and go to the URL. If you don't get it in time, you'll see a message sayingConnection closed, stop debugging. If this happens, restart vim and try again. If you do get it, you'll see a number of vim windows open and see a message saying:connection from ('127.0.0.1', 44027) Press ENTER or type command to continueOnce you have the debugging session up, you can start stepping through the code, setting breakpoints, inspecting variables and everything else you would normally do with a debugger. A full description of how to use a debugger is a bit beyond this article, but here's a quick summary:
- The current PHP source file is shown on the left; the current line is highlighted in red.
- Use F2 to step into function calls and F3 to step over them.
- Breakpointed lines are shown by being highlighted in green. Use the :Bp command to set a breakpoint on the current line. You can open new source files using the :e command, (i.e.
:e /var/www/magento/app/Mage.php), set a breakpoint in them using :Bp and then press F5 to continue execution until the next breakpoint. - Use F11 to dump all current context (i.e. function variables) to the window at the top-right. Use F12 to see what's in the PHP variable under the cursor.
- Use Ctrl-W followed by an arrow key to move between the different vim windows. This can be useful for scrolling up in the watch window.
This debugger is relatively easy to setup and can be very helpful in seeing exactly what's happening as Magento is running. You can debug any action in the Magento frontend or backend, and using breakpoints you can start following execution wherever you want. One very important point to note is that having Xdebug enabled will cause a severe performance hit. Don't forget to disable it when you're done!